
12 Apr Unlocking the power of data visualisation with Snowflake Streamlit
Unlocking the Power of Data Visualisation with Snowflake Streamlit
Understanding Streamlit
In today’s fast-paced digital era, effective data visualisation is crucial for deriving insights and making informed decisions. Enabling developers to create compelling visualisations and share insights for clients and their stakeholders is vital for organisations that need to convey complex information effectively. Streamlit simplifies the process of creating interactive and high-performance data visualisations by leveraging a powerful Python framework.
With Snowflake acquiring Streamlit in March 2022, Snowflake has been improving integration with their platform. Interactive apps that work on your data and Machine Learning models can be developed on the Snowflake platform. Snowflake says themself, “Data scientists and Python developers can now combine Streamlit’s component-rich, open-source Python library with the scale, performance and security of the Snowflake platform”.
Streamlit stands out as a great Python framework designed specifically for creating dashboards and reports with ease. Its declarative syntax makes it incredibly beginner-friendly, allowing developers to quickly generate interactive data visualisations. Streamlit operates directly on top of Python, making it a versatile and accessible tool for data professionals.
Getting Started with Streamlit
Getting started on Streamlit is as easy as installing a python library. The real-time feedback feature, which allows automatic updates on file changes, enhances the development process by showing the live changes on dashboards and reports, as they’re made. Text, data frames and complex objects can be displayed in a clean and organised manner. The nature of Streamlit enables developers to preview data quickly, which is suited for fast iterative and agile report development.
The power of Streamlit lies in its ability to offer a high level of customisation. There are many customisation and interactivity options, such as input widgets, buttons, sliders, and multi-selects.
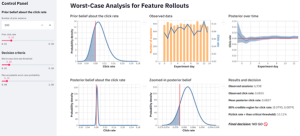
Source: https://www.crosstab.io/articles/streamlit-review/
Streamlit Killer Features
Streamlit has a plethora of capabilities, such as integration with machine learning models, dynamic updates, and advanced layout design and adaptability to connect various data sources. Its open-source nature helps keep it up to date and contemporary.
- Ease of Use: The syntax is straightforward; developers can quickly build interactive web applications using familiar Python scripting.
- Reactive Programming Model: By leveraging this model, Streamlit changes in state, automatically updates the UI without needing complex event handling code.
- Automatic Widget Inference: To reduce the required boilerplate code in dashboards and screens, Streamlit automatically infers the appropriate widgets, such as sliders for numeric values and select boxes for categorical variables.
- Wide Range of Widgets: Streamlit provides a comprehensive set of widgets for building interactive user interfaces, and supports custom widgets by integrating them seamlessly with popular Python libraries like Pandas, Altair, Plotly, Matplotlib, and more.
- Sharing and Deployment: Streamlit makes it easy to share and deploy web applications through Streamlit’s native hosting ‘Streamlit Sharing’, or through standalone executable files that can be packaged for end-users.
- Integration with Machine Learning Libraries: Streamlit integrates seamlessly with popular machine learning libraries like TensorFlow, PyTorch, and scikit-learn, allowing developers to create data-driven applications with minimal effort.
- Extensions and Customisation: The Streamlit ecosystem offers a suite of extensions and components to enhance its functionality that developers can further customise using HTML, CSS and Javascript.
Major companies like Uber, Apple, Intel, Walmart, Tesla, and IBM are already leveraging Streamlit for not only its simplicity, but also for its effectiveness in conveying complex data insights.
Key Takeaway’s
Streamlit emerges as a game-changer in the realm of data visualisation. It’s an ideal choice for both beginners and experienced data professionals, while being powerful enough for use across Enterprise organisations. By incorporating Streamlit into data projects, a new level of efficiency in creating interactive and impactful visualisations can be unlocked.
InfoCentric specialises in visualisation solutions. Reach out to our team on how we can help your organisation make the most of your data.
Where can I find out more?
Streamlit: https://streamlit.io/
Learn more:
Dashboards and Visualisations: Why are pie charts bad?!
How Is Data Analytics Used In Financial services?
Our Modern Data Platforms series
Streamlit page on Snowflake.com